


Explaining the gender pay gap

With the new data from the ABS showing that their version of the gender pay gap is at 12% - the lowest point ever - and WGEA publishing gender pay gaps for employers on the 27th of February, gender pay gaps are definitely in the headlines at the moment.
Something I’ve realised from reading articles and comments on posts though, is just how misunderstood the gender pay gap actually is. And I completely understand why. It can be really confusing and there are a lot of misconceptions about the gender pay gap. So I want to try to make clear what it is, what it isn’t, and some answers to some of the most common questions or challenges.
(If you want the TL;DR version – I made an Instagram post to do the high level explanation. But this post steps out all the detail to help you really make sense of the gender pay gap and the common misconceptions.)
A quick note on terms before we go on
The terms average and median will get used a bit when talking about pay gaps. I am not a maths person (despite genuinely being fascinated by data - go figure) and I suspect I’m not the only one who maybe needs a refresher, especially when average and median and mean are sometimes used interchangeably.
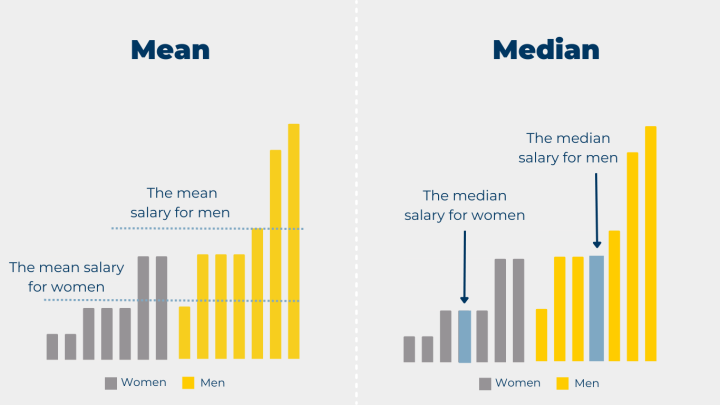
Basically, the average is the number you get when you add all the numbers together and divide by how many numbers there are (also sometimes called the mean). The median is the middle number if you arrange all the numbers from smallest to largest.
To confuse things slightly, WGEA usually talks about the average gender pay gap, but for the employer gender pay gaps published this week they will be the median gender pay gap.
This visual example from WGEA gives a sense of the difference between the average (mean) and the median when looking at salary.
While on terms, I also want to acknowledge that gender exists beyond the male:female binary. However, reporting non-binary employee data is currently voluntary for the WGEA reporting so it isn’t able to give a clear picture of the remuneration for non-binary people.
Research on intersectionality of all kinds is slowly improving but is still far behind where it could be. We can’t make significant changes without the data to understand where we are, and how far we have to go. So I just want to put up front that the intersectionality is just not there when it comes to what data we have.
When we’re talking about the gender pay gap, it is limited to the distinction between men and women and is not more encompassing than that for any other forms of diversity. (Although, I’d put good money on the gender pay gap being larger for women of colour and First Nations women.)
To start: the gender pay gap is not the same as equal pay
A lot of people confuse the gender pay gap with equal pay, or use them interchangeably. Some people say there couldn’t possibly be a gender pay gap because men and women are paid the same for the same roles. It’s the law.
And yes, it is the law. But this isn’t what the gender pay gap is. Although it definitely is a contributor to the gender pay gap – because even though it has been the law for 55 years, equal pay for equal work isn’t always done in practice.
The history of equal pay for equal work in Australia is actually fascinating and infuriating at the same time (did you know even under so-called ‘equal pay’, men got an additional ‘breadwinner’ component of their pay that women did not?)
You can’t just close the gender pay gap by paying men and women the same pay for the same work.
So what is the gender pay gap then?
The gender pay gap shows us the difference between the average or median pay of women and men. This can be measured across the whole workforce, or across a specific industry or organisation.
It isn’t necessarily about a comparison of ‘like for like’ roles in this circumstance. Although, many organisations which do a gender pay gap analysis find that they actually do not have equal pay for men and women across ‘like for like’ roles. Whoops!
I think one of the reasons for confusion about the gender pay gap is because there are so many different numbers that can be called the ‘gender pay gap’,
The calculation for the gender pay gap is basically always the same, no matter which data you’re using:
[earnings of men - earnings of women] / earnings of men x 100 = gender pay gap %
But there are lots of different types of data you can use that impacts what number you end up with.
To make sense of the differences in the numbers, it can be helpful to understand what data those numbers are based on, what’s included and (very importantly) what’s not.
The ABS data tells us there is a 12% national gender pay gap
This number uses the ‘Average Weekly Earnings’ data the ABS collects. This data is made up of ‘Estimates for average weekly ordinary time earnings for full-time adults’ and is collected via a survey of around 5,600 businesses. This sample includes a representative range of business sizes, industries, private/public sector and states. (Source: ABS, Average Weekly Earnings, Australia, November 2023)
However, this data set data set only takes into account:
Base salary – it does not include salary sacrifice, in-kind compensation, superannuation, or bonuses that are irregular or are paid half-yearly or annually
Full-time employees – it does not include part-time or casual employees
The benefits of this data are that it’s regular (twice a year), and has a lot of historical data so we can see progress over time. It can also provide insight into the weekly earnings for men and women, which shows the way the gender pay gap really impacts take-home earnings.
The obvious limitation of this data is that it doesn’t include part-time or casual workers, especially as women are disproportionately represented in part-time work.
Women make up 48% of the total workforce. But 69% of the part-time workforce and only 39% of the full-time workforce. This means 43% of all working women are not included in this ABS data (compared with the 20% of working men not included).
Source: ABS Labour Force, January 2024

While many people will say that women are making a choice to work part-time, and we can acknowledge working part-time can often be a personal choice, no choice is made in a vacuum and those ‘choices’ are impacted by other factors. And I really should say ‘work in paid employment part-time’, because women continue to do a disproportionate amount of unpaid work no matter their paid work status. Analysis shows that in Australia, on average, a woman spends 43% less time in paid work than a man, but 81% more time in unpaid work (CEW, 2022).
Australia has the highest percentage of ‘involuntary part-time’ working women in the OECD. Involuntary part-time work means people in part-time work who want to work more hours but are unable to. There are a number of structural reasons for this, such as the challenges of affordability and availability of ECEC, but unpacking all the reasons behind women being over-represented in part-time or casual work would need to be a whole other post all on its own!
Another limitation of this data is that it doesn’t count things like bonuses so we don’t get a clear picture of the ‘added extras’ men often receive in the workplace and its impact on the gender pay gap.
And before anyone suggests that bonuses are clearly just merit based and therefore not subject to gender bias: research from BCEC and WGEA shows that women working full-time are paid an average additional 18.1% of their base salary in extras while men gain an additional 25% of their base salary. That leads to an average male ‘bonus’ premium of almost 8 percentage points for full-time workers. The male ‘bonus’ premium is highest in the Financial and Insurance Services industry at 15 percentage points (BCEC | WGEA, 2016).
A study by Mercer also found that men were receiving up to 35% more in performance bonuses than women, despite receiving the same performance rating. Let’s not get started on the myth of meritocracy right now though.
Basically, the thing to remember when we see the 12% number, is that while this gets called a national gender pay gap, it is more accurately the gender pay gap of base salaries for full-time employees.
The WGEA data tells us there is a 21.7% national gender pay gap
This data is based on information reported to WGEA by private sector employers with 100 or more employees. These organisations are legally required to report this data to WGEA (although some are non-compliant).
The reporting to WGEA includes a range of gender equality indicators, including remuneration.
This data includes:
Private sector employers with 100 or more employees
Most employees, including part-time and casual/contract workers
Total actual remuneration – incorporates wages/salary, superannuation, overtime and bonuses paid to an employee during the reporting period
If you’re wondering how it can account for the difference in part-time and full-time pay – all remuneration data is annualised. So this means if a person worked part-time, their earnings are converted to what they would be for full-time hours to control for difference in working hours.
You might also note that this figure is only for the private sector. The public sector was previously not included in reporting to WGEA. It then moved to voluntary reporting, and now mandatory reporting for public sector employers of 100 employees or more. The national gender pay gap figure WGEA publishes doesn’t currently include the public sector, but employer gender pay gaps for the public sector will be published either later in 2024 or early in 2025.
I also mentioned that the data includes ‘most employees’. The current data does not include CEOs, Heads of Business or Casual Managers – but it will from next year. This is also the reason that we’re only getting median, rather than average, gender pay gaps for employers in 2024. (As CEO remuneration is usually very high and 80% of CEOs are men it would skew the average, but has minimal impact on the median).
A clear limitation of this data is that it does not include any employers with fewer than 100 employees.
97.3% of businesses in Australia are categorised as ‘small businesses’ (fewer than 20 employees) so this is clearly not capturing a large number of individual employers. (Source: ASBFEO, Number of small businesses in Australia). In terms of how many employees this covers, ASBFEO also indicates that small businesses account for 42% of all employees in the workforce.
The reason for business with fewer than 100 employees not reporting to WGEA is reducing regulatory burden – which is also a whole discussion, but wanted to mention it to give some general insight into why small/medium businesses are not included in the data contributing to the national gender pay gap number in WGEA’s figures. (For reference, the UK gender pay gap reporting is for organisations with 250 or more employees).
Isn’t the gender pay gap just because men work longer hours?
A common myth about the gender pay gap is that it can be easily explained away by the fact that men work longer hours. The majority of all part-time employees are women (69%) whereas the majority of full-time employees are men (61%).
But even if men and women worked the same hours, there would still be a gender pay gap. Recent ABS data shows that on average, hourly earnings were $46.10 for men, compared to $42.00 for women, an 8.9% gap.
Men earn more per hour than women in all major occupation groups (yes, even the female-dominated ones). The difference between average hourly earnings for men and women was greatest for Managers ($14.10 per hour or 19%) and lowest for Sales workers ($2.30 per hour or 7%).
Source: ABS, Employee Earnings and Hours, May 2023

The hourly data gives a really clear picture that the time worked doesn’t factor in (even though the WGEA data is annualised to also account for the difference in part-time v full-time employment). So even when controlling for hours worked, there is still a gender pay gap.
But men just work in higher paying jobs, right?
One of the biggest misconceptions, right after ‘men work longer hours’ is ‘men work in higher paying jobs’ and ‘women choose to work in lower paid industries’.
People’s assumptions about this might feel right at first glance. Male-dominated industries are higher paying, and a lot of female-dominated industries are lower paying so that’s obviously the reason for the gender pay gap, right? Another one of those pesky personal choices by women that just happen to put them at a financial disadvantage. But on closer examination, this myth doesn’t stack up either.
Every occupation and every industry and every level of management has a pay gap that favours men. Even the female-dominated industries and occupations. So it doesn’t really work to say that men’s jobs just happen to be in higher paying industries. If it was just a difference between industries and occupations, we would expect to see a much lower or non-existent gender pay gap in female-dominated industries like health care (where the gender pay gap is 13% – so not exactly at parity there).
Highly feminised industries and occupations do attract significantly lower wages, but it’s because of the undervaluation of women's work, rather than an objective difference in monetary value. In fact, research shows that even where men’s low-wage jobs require less skill or qualifications than women’s low-wage jobs, the male-dominated ones usually have a higher hourly pay (KPMG, 2016).
It’s also not the case that women just choose to enter professions that are historically feminised and undervalued, and therefore paid less. Data shows that women joining high paying, male-dominated roles in large numbers equates with a drop in pay for that industry. The higher the percentage of women in an industry, the lower its perceived prestige.
This can be seen when more women became graphic designers (wages fell 34%), housekeepers (wages fell 21%) and biologists (wages fell 18%) (Levanon et al, 2009). The reverse is also true when a previously feminised industry attracted more men. Computer programming used to be a ‘menial’ role largely done by women. But when men started outnumbering women in the industry, the jobs began paying more and were associated with greater ‘prestige’.
Women don’t choose lower paid work – the lower pay follows them.
But… it’s clearly just [insert reason here]
It actually doesn’t matter what rationale people try to use to justify or explain it away, the data is clear. There is a gender pay gap. The reasons for it are many and varied, but it undeniably exists. And it is not due to the individual choices of women. Structural inequalities and barriers have impacted women in the workforce as long as people have been working.
Despite all the focus on women’s personal choices, gender discrimination and bias is actually the number one driver of the gender pay gap (KPMG, 2022). So as much as we can try to explain it away, it’s still going to be there. In every industry, in every occupation, in almost every workplace.
WGEA’s Gender Equality Scorecard shows that 73% of employers who report to them have a 5% or greater gender pay gap that favours men. And while we absolutely need to understand why the gender pay gap exists (again, could be a whole other post), let’s focus on this new publication of employer pay gaps for now.
So, what’s actually happening on 27 February?
Previously, gender pay gaps have been reported by WGEA at a national level and at an industry level. (And reminder that the data we’re talking about here is only from those required to report to WGEA: private sector employers with 100 or more employees).
The information publicly available via wgea.gov.au for individual employers has, until now, been gender composition of their workforce and whether the employer have taken actions to address gender inequality in the workplace (such as whether they’ve done a pay gap audit, if they have policies in place to address the gender pay gap or sexual harassment in the workplace etc.).
On February 27, WGEA will also publish the median pay gap, the gender composition per pay quartile and an Employer Statement for each organisation for the 1 April 2022 - 31 March 2023 reporting period. The Employer Statement is an opportunity for employers to give context for their gender pay gap and outline their plans for action. I am definitely curious to see how some organisations plan to address their gender pay gap in their statement!!
Importantly, I want to make sure you know that this data can’t specifically tell you if your male colleagues are making more money than you. It can tell you what the median gender pay gap is for your organisation and tell you how many women compared to men are employed in each pay quartile. You can use this information to start some discussions though. And make sure your workplace is taking action to address the gender pay gap.
What else do I need to know?
The WGEA data shows the median national gender pay gap is 19% – this is a good starting place to benchmark how your organisation stacks up when you look at their gender pay gap. But also look at other similar employers in your industry to know how your organisation is actually performing.
It’s not enough for workplaces to know the number for their gender pay gap. They should also be able to talk about the specific reasons for their gender pay gap, and what they’re doing to address them.
If anything, the real test is next year when the second year of reporting comes out. Discussion about the gender pay gap isn’t going away, and every year when the pay gaps are published it gives us a good sense of who is actually putting the effort into addressing the issues.
Bring on the pay transparency. I will be watching how all this unfolds with great interest.